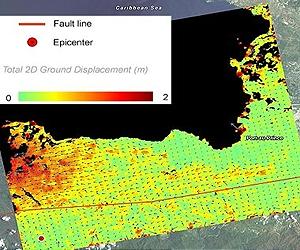
The image shows movements in the Earth's crust caused by the earthquake in Haiti on 12 January 2010. The colour scale shows the extent of the displacements, from green for small displacements to deep red for movements of two metres. The red-coloured area north of the Enriquillo fault zone (red line) was displaced by about 80 centimetres during the earthquake, in the direction of the oblique radar view.
This corresponds to a horizontal movement of about 1.3 metres to the west. The rapid drop in the deformation from west to east, over a distance of only a few kilometres – shown by the gradient from red to green – indicates a stretching of the Earth's crust in this area.
The measurements were obtained by a correlation comparison of two TerraSAR-X radar images, acquired on 18 February 2009 and 14 January 2010. The colours indicate the amount of movement and the arrows indicate the direction.
Due to the satellite's orbit and the Earth's rotation, the geometry of the radar images is turned about 12 degrees counterclockwise.
The accuracy of the measurement technique lies within a range of 30 centimetres. Because of the 30-kilometre width of the TerraSAR X image strip, the measurements are limited to the coloured area.
Share This Article With Planet Earth
